

Client Overview
Client: Hindalco Industries Ltd. (Aditya Alumina Refinery Project)
Industry: Aluminium Recycling & Manufacturing
Location: Kansariguda, Podapadi, Rayagada, Odisha – 765015
Solution Implemented: Industrial Energy Monitoring System, Smart Energy Management, Sankey Energy Flow Monitoring, NTS IoT Gateway & Real-Time Electrical Parameter Monitoring
Deployment: Intelligent Industrial Energy Monitoring & Energy Loss Identification Platform
Overview
Hindalco Industries Limited, the metals flagship company of the Aditya Birla Group, operates energy-intensive aluminium manufacturing facilities where uninterrupted power distribution is essential for continuous production. Every unit of electricity directly impacts operational efficiency, production performance, and manufacturing costs.
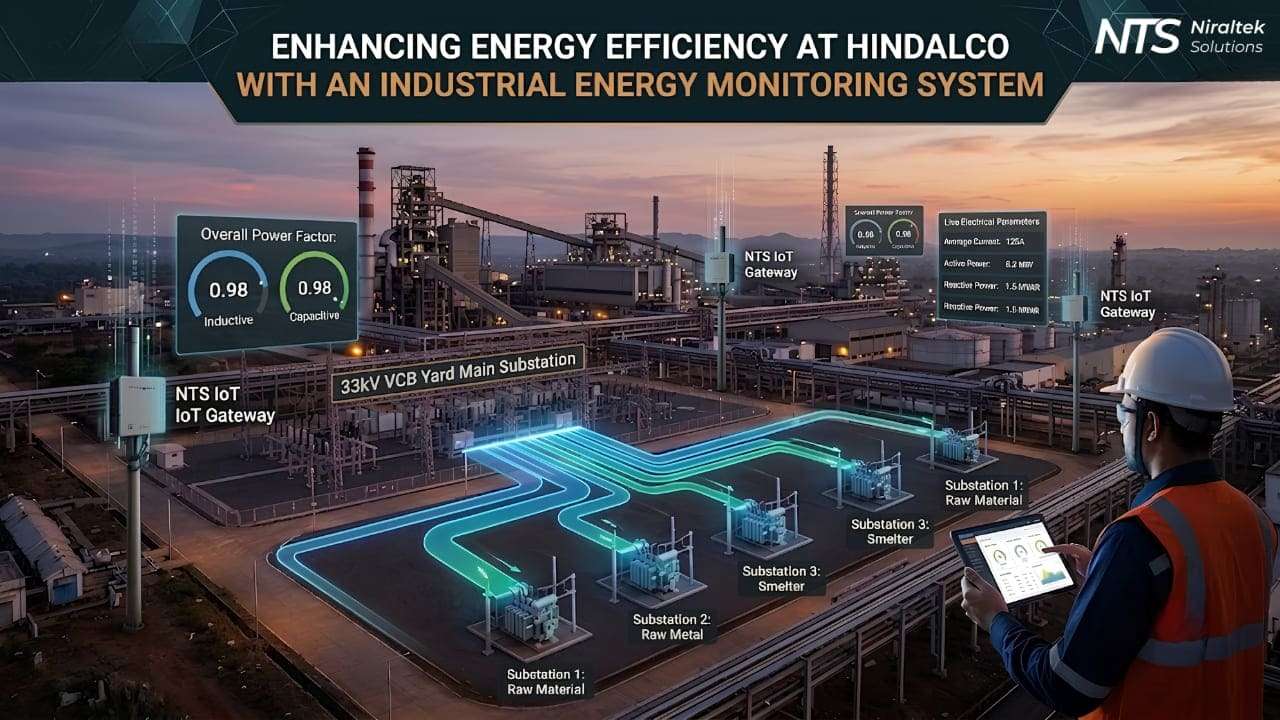
The refinery receives electricity from the Government Power Grid through the 33kV VCB Yard Main Substation, where power is distributed across five downstream substations supplying different operational areas. Monitoring this complete power flow manually made it difficult to identify hidden energy losses, abnormal current consumption, and electrical inefficiencies.
To solve this challenge, Niraltek implemented an intelligent Industrial Energy Monitoring System that provides real-time energy monitoring, Sankey-based energy flow analysis, live electrical dashboards, historical energy analytics, and automated reporting from a centralized cloud platform. The Industrial Energy Monitoring System enables complete visibility into power distribution and supports faster operational decision-making.
Industrial Energy Monitoring System Objective
The objective was to create a centralized Industrial Energy Monitoring System capable of continuously tracking incoming electricity, monitoring substation-wise power distribution, and helping engineers identify hidden energy losses through real-time operational intelligence.
The project focused on:
- Monitoring 33kV incoming power
- Tracking power distribution across 5 substations
- Identifying energy losses using Sankey visualization
- Live electrical parameter monitoring
- Hourly, daily & monthly energy analytics
- Historical report comparison
- Device event monitoring
- Power factor analysis
- Offline Industrial IoT connectivity
Business Challenges
Limited Visibility Across Power Distribution
Although electricity entered through a single VCB Yard, engineers had limited visibility into how power was distributed across multiple substations.
Hidden Energy Losses
Without centralized monitoring, identifying where energy losses occurred required manual calculations and delayed operational decisions.
Manual Electrical Analysis
Electrical parameters such as current, voltage, active power, and reactive power were reviewed periodically instead of continuously.
Difficulty Comparing Historical Data
Investigating abnormal electrical behavior required multiple reports, making day-to-day comparison inefficient.
Network Downtime
Temporary communication failures created challenges in maintaining continuous operational records.
Proposed Industrial Energy Monitoring System
Niraltek developed a centralized Industrial Energy Monitoring System that digitally connected Hindalco’s electrical infrastructure into a single intelligent monitoring ecosystem.
Infrastructure deployed
- 33kV VCB Yard incoming power monitoring
- Five substation energy monitoring network
- Seven NTS IoT Gateways
- Electrical meter integration
- Centralized cloud monitoring platform
- Historical energy database
- Offline data synchronization
As part of the solution, 7 NTS IoT Gateways act as the communication backbone by supporting Wi-Fi, Ethernet, and GSM SIM connectivity. During network interruptions, gateways continue collecting data locally and automatically synchronize it with the cloud once connectivity is restored.
Industrial Energy Monitoring Architecture
Power Distribution Layer
Electricity enters the refinery through the 33kV VCB Yard Main Substation and is distributed to five downstream substations. The monitoring platform measures both incoming and outgoing energy to provide complete visibility into power distribution.
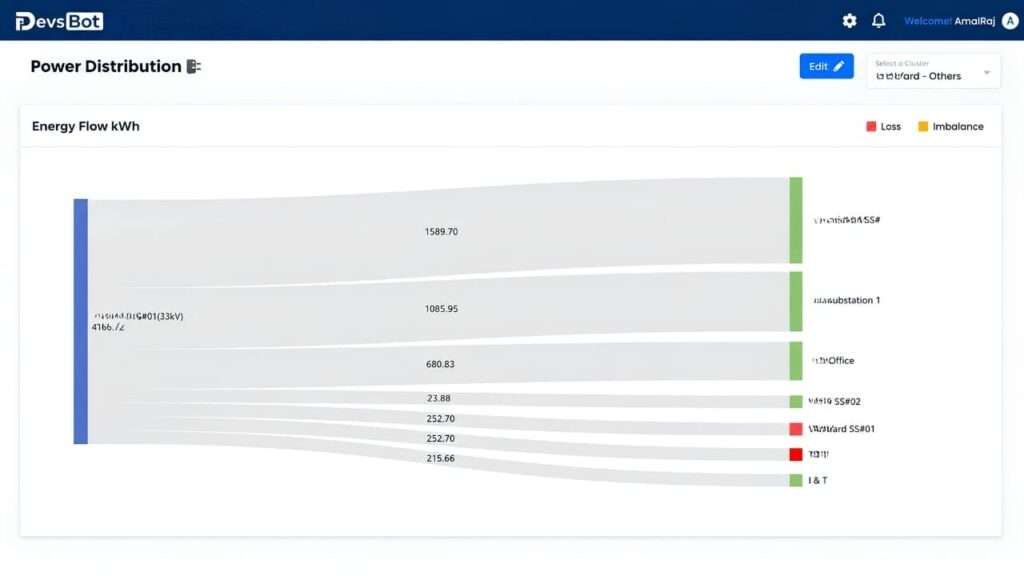
The Sankey dashboard visually represents energy flowing from the main substation to all five substations while automatically calculating total energy loss across the distribution network.
Edge Connectivity Layer
Seven NTS IoT Gateways securely collect electrical meter data from different locations and transmit it to the centralized monitoring platform through Wi-Fi, Ethernet, or GSM connectivity.
Cloud Monitoring Platform
All operational data is securely stored within the Industrial Energy Monitoring System, where engineers can access live dashboards, historical reports, downloadable records, and advanced energy analytics from a centralized cloud platform.
Key Industrial Energy Monitoring Capabilities
24×7 Live Energy Insights Dashboard
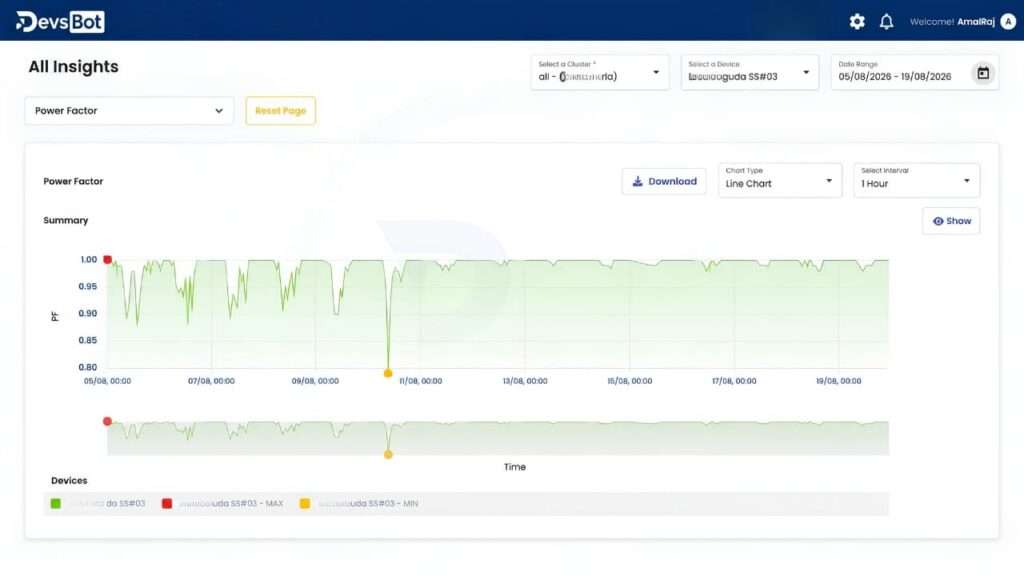
The Industrial Energy Monitoring System features a 24×7 Live Energy Insights Dashboard that provides real-time monitoring of every connected electrical device. Users can select individual substations, choose electrical parameters, apply custom date ranges, and visualize operational performance through interactive charts.
Dashboard capabilities
- Live current-day monitoring
- Device-wise parameter selection
- Custom date filtering
- Downloadable historical reports
- Interactive line & bar charts
Real-Time Electrical Parameter Monitoring
The platform continuously monitors critical electrical parameters including:
- Voltage
- Average Current
- Active Power
- Reactive Power
- Apparent Power
- Frequency
- Power Factor
- Energy Consumption (kWh)
Users can customize the dashboard based on the parameters they want to monitor.
Hourly, Daily & Monthly Energy Analytics
The monitoring platform allows engineers to analyze energy performance at different time intervals.
| Analytics | Purpose |
| Live Line Chart | Current-day monitoring |
| Bar Chart | Hourly electrical analysis |
| Daily Report | Day-wise energy summary |
| Monthly Trend | Monthly consumption analysis |
| Historical Comparison | Compare any custom date range |
Historical comparison helps engineers investigate abnormal operating conditions by comparing two or more different days.
Overall Report & Day-Wise Summary
The Overall Report is a key feature of the Industrial Energy Monitoring System, providing day-wise summaries, minimum and maximum values, historical comparisons, and operational performance analysis. This enables engineers to perform Energy Analytics, compare multiple date ranges, and identify abnormal electrical activities with greater accuracy.
The report includes:
- Day-wise energy consumption summary
- Minimum & maximum recorded values
- Overall operational performance summary
- Historical comparison between any two dates
- Multi-day trend analysis
- Downloadable reports for audit and performance review
This enables maintenance teams to quickly compare historical operating conditions whenever abnormal activity occurs.
Device Event Snapshot
Within the Overall Report, the platform automatically captures important electrical events for every connected device.
Event snapshot includes
| Event | Purpose |
| Lowest Current Consumption | Detect low-load conditions |
| Maximum Active Power | Identify peak operational load |
| Maximum Reactive Power | Monitor reactive power behavior |
| Maximum Current Consumption | Detect abnormal current spikes |
This helps engineers investigate abnormal activities without manually reviewing thousands of electrical records.
Power Factor (PF) Analysis
The system continuously evaluates power quality by monitoring Power Factor (PF) and classifying defective conditions into two categories:
- Inductive PF
- Capacitive PF
Early detection of PF abnormalities helps improve electrical efficiency and reduce unnecessary energy losses.
Implementation
Phase 1 – Site Assessment
Evaluation of the VCB Yard, substations, electrical meters, and monitoring requirements.
Phase 2 – Gateway Deployment
Installation of seven NTS IoT Gateways and integration with electrical monitoring devices.
Phase 3 – Platform Configuration
Configuration of Sankey dashboards, live monitoring, analytics, reporting, and cloud synchronization.
Phase 4 – Operational Monitoring
Continuous monitoring of electrical parameters, abnormal activity detection, and energy-loss analysis.
Business Outcomes
Following the implementation of the Industrial Energy Monitoring System, Hindalco established a centralized and data-driven approach to industrial energy management, improving power distribution visibility, historical energy analytics, and operational decision-making.
Key outcomes
- Complete visibility into 33kV power distribution
- Monitoring across five substations
- Real-time identification of energy losses
- 24×7 live electrical monitoring
- Hourly, daily & monthly analytics
- Historical performance comparison
- Automated downloadable reports
- Device-wise abnormal activity detection
- Power Factor monitoring
- Reliable offline data synchronization
Before vs After
| Before | After |
| Manual power monitoring | Real-time centralized monitoring |
| Limited energy visibility | Sankey energy flow visualization |
| Separate substation records | Unified cloud dashboard |
| Manual historical analysis | Instant date-range comparison |
| Reactive maintenance | Abnormal activity detection |
| Data loss during outages | Offline gateway synchronization |
Key Business Benefits
By implementing the Industrial Energy Monitoring System, Hindalco improved operational visibility, strengthened energy management, and enabled engineers to make faster data-driven decisions through centralized monitoring and historical energy analytics.
- Improved visibility into industrial power distribution
- Faster identification of hidden energy losses
- Centralized monitoring across five substations
- Data-driven operational decision making
- Automated historical reporting
- Improved electrical performance analysis
- Reliable Industrial IoT communication
- Continuous monitoring during network failures
- Scalable infrastructure for future energy optimization
Conclusion
Niraltek’s Industrial Energy Monitoring System transformed Hindalco’s electrical distribution network into a centralized, intelligent, and data-driven energy management platform. By monitoring incoming power from the 33kV VCB Yard, tracking distribution across five substations, and visualizing energy flow through Sankey dashboards, the solution enables engineers to identify hidden energy losses, compare historical performance, and improve operational efficiency through real-time electrical intelligence.